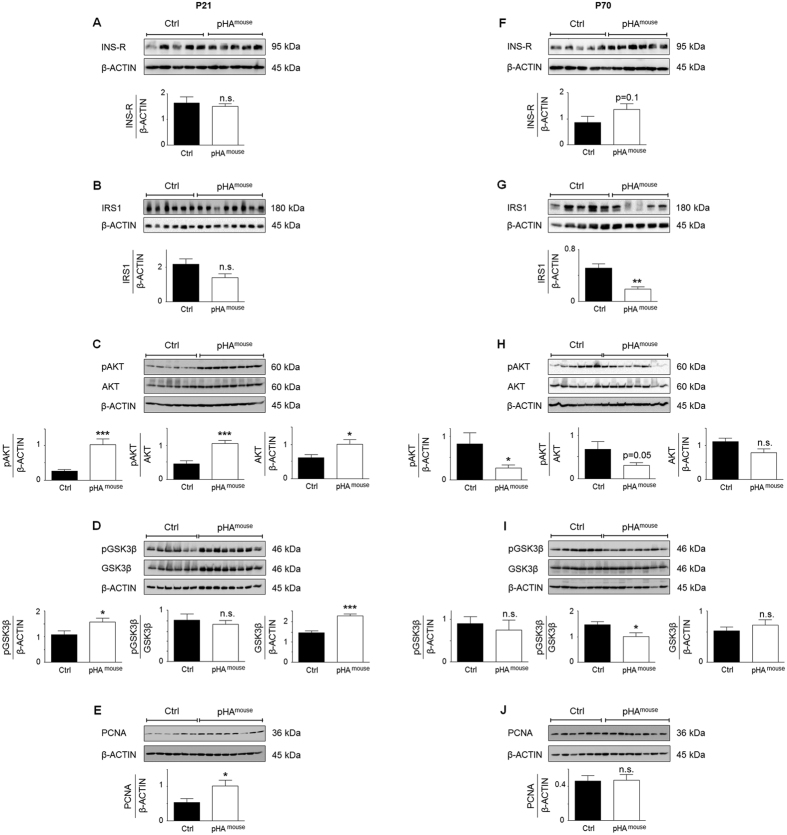
Figure 6. Early postnatal hyperalimentation (pHA) with early-onset obesity induces transient activation of intrinsic pulmonary insulin signaling at postnatal day 21 (P21), and inhibition at P70.
(A–E) Immunoblots showing indicators of insulin signaling at P21. (A) Protein expression of insulin receptor (INS-R) in lungs at P21; Ctrl: n = 5 from 4 litters; pHAmouse: n = 5 from 4 litters. (B) Protein abundance of insulin receptor substrate 1 (IRS1) in lungs at P21; Ctrl: n = 6 from 4 litters; pHAmouse: n = 8 from 4 litters. (C) Assessment of phosphorylated AKT (pAKT) and total AKT in the lungs at P21; Ctrl: n = 6 from 4 litters; pHAmouse: n = 8 from 4 litters. (D) Immunoblots showing phosphorylated and total GSK-3β in lungs at P21; Ctrl: n = 6 from 4 litters; pHAmouse: n = 8 from 4 litters. (E) Protein abundance of proliferating cell nuclear antigen (PCNA) as an index of proliferation at P21; Ctrl: n = 6 from 4 litters; pHAmouse: n = 8 from 4 litters. (F–J) Assessement of indicators of insulin signaling at P70 using immunoblots. (F) Protein expression of INS-R in the lungs at P70; Ctrl: n = 5 from 4 litters; pHAmouse: n = 5 from 4 litters. (G) Protein abundance of IRS1 in lungs at P70; Ctrl: n = 5 from 4 litters; pHAmouse: n = 5 from 4 litters. (H) Immunoblots for pAKT and total AKT in lungs at P70; Ctrl: n = 6 from 4 litters; pHAmouse: n = 8 from 4 litters. (I) Phosphorylated and total GSK-3β in lungs at P21; Ctrl: n = 6 from 4 litters; pHAmouse: n = 8 from 4 litters. (J) Immunoblots showing PCNA at P70; Ctrl: n = 6 from 4 litters; pHAmouse: n = 8 from 4 litters. Densitometric analyses were performed and are shown below the corresponding immunoblot; β-ACTIN served as loading Control (Ctrl). Mann Whitney or unpaired t-test. pHAmousegroup: white bar; Ctrl: black bar. Mean ± SEM; *p < 0.05, **p < 0.01, ***p < 0.001; n.s. = not significant.

