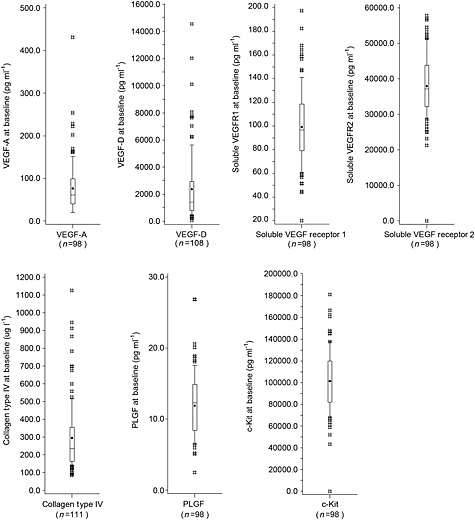
Figure 1.

Boxplots of biomarker distribution at baseline from pooled everolimus and placebo patients. Medians are displayed as a line and means are displayed as dots. Boxes are drawn from the 25th to 75th percentiles, and whiskers extend to the 10th to 90th percentiles. Values that lay outside the 10th to 90th percentiles are indicated by a hash symbol (#). PLGF, placental growth factor; VEGF‐A, vascular endothelial growth factor A; VEGF‐D, vascular endothelial growth factor D
