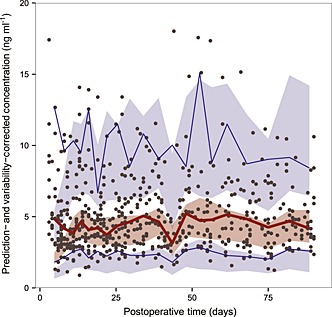
Figure 2.

Prediction‐ and variability‐ corrected visual predictive check (pvcVPC) plot of the model by Størset et al. 30. The solid red line represents the median prediction‐ and variability‐corrected observations and semitransparent red field represents a simulation‐based 95% confidence interval (CI) for the median. Solid blue lines represent the corrected observed 5th and 95th percentiles and semitransparent blue fields represents a simulation‐based 95% CI for the corresponding model predicted percentiles. The prediction‐ and variability‐corrected observations are represented by black circles
