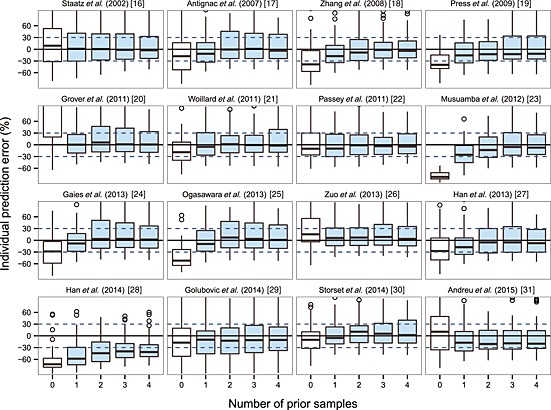
Figure 4.

Box plots of individual prediction error (IPE%) with Bayesian forecasting for 16 published population pharmacokinetic models in different scenarios (0 represents predictions without prior information and 1‐4 represents with prior one to four observations, respectively). In scenario n, prior n observations were used to estimate the individual prediction and it was then compared with the corresponding observation
