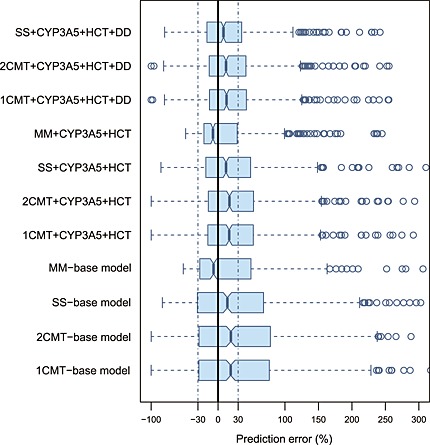
Figure 5.

Box plots of prediction error (PE%) for four structural models with and without covariates. The black solid line and blue dotted lines are reference lines indicating PE% of 0% and ±30%, respectively. 1CMT, one compartment model; 2CMT, two compartment model; CYP3A5, CYP3A5*3 polymorphism; DD, tacrolimus daily dose; HCT, haematocrit; MM, Michaelis–Menten model; SS, steady‐state infusion model
