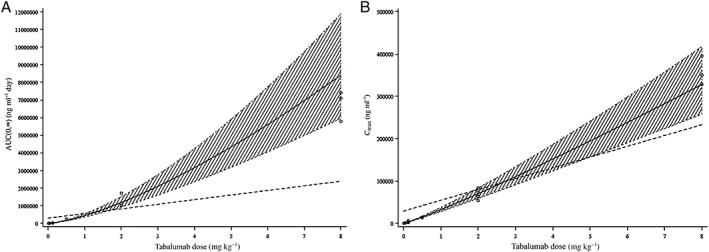
Figure 2.

Dose proportionality assessment for (A) AUC(0,∞) and (B) C max, respectively, following intravenous administration (study A). The shaded area indicates the 95% confidence interval for the predicted line. The solid line denotes the predicted line from the fitted model. The dotted line indicates the predicted line if the PK parameters were dose proportional
