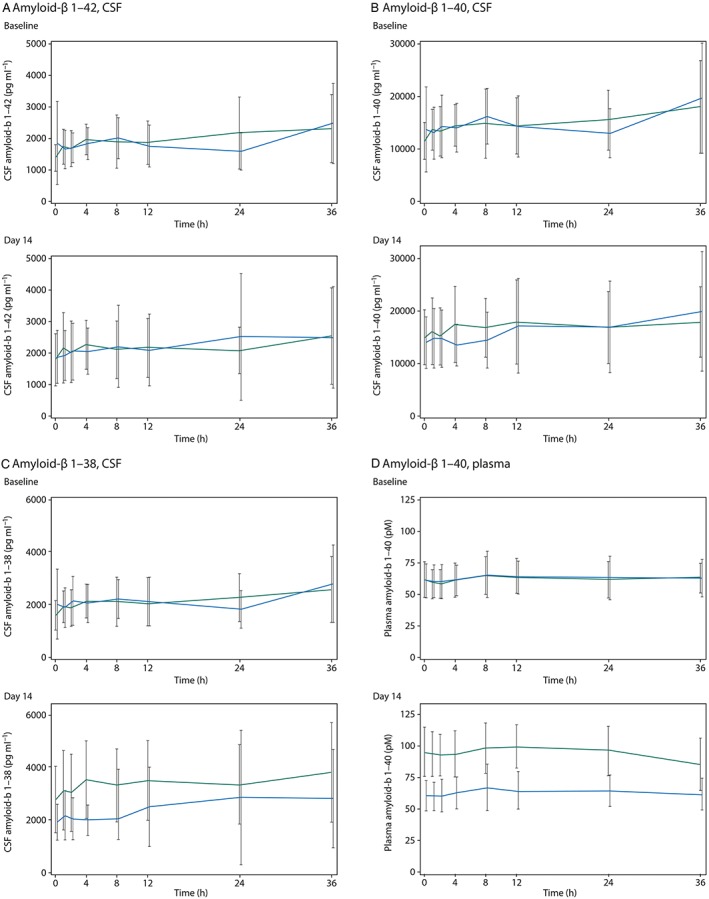
Figure 1.

Concentration of amyloid‐β isoforms by timepoint at baseline and on day 14 for LCZ696 (green lines) and placebo (blue lines) groups, (A) amyloid‐β 1–42 in cerebral spinal fluid, (B) amyloid‐β 1–40 in cerebral spinal fluid, (C) amyloid‐β 1–38 in cerebral spinal fluid and (D) amyloid‐β 1–40 in plasma
