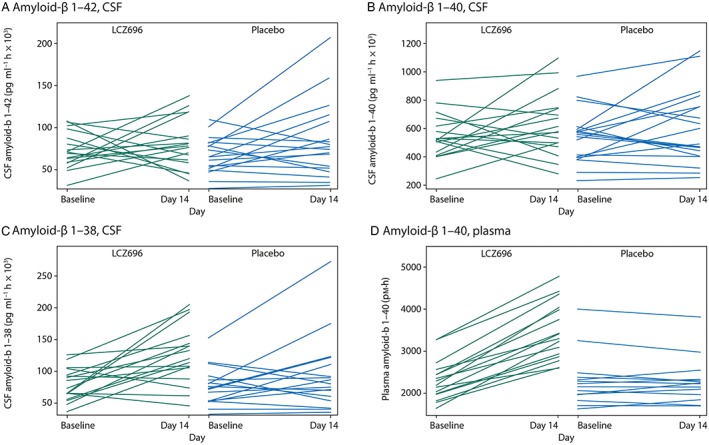
Figure 2.

Individual subject ping‐pong plots of amyloid‐β isoform AUEC(0,36 h) at baseline and at day 14 for LCZ696 (left‐hand graph of each panel) and placebo (right‐hand graph of each panel) groups, (A) amyloid‐β 1–42 in cerebral spinal fluid, (B) amyloid‐β 1–40 in cerebral spinal fluid, (C) amyloid‐β 1–38 in cerebral spinal fluid and (D) amyloid‐β 1–40 in plasma
