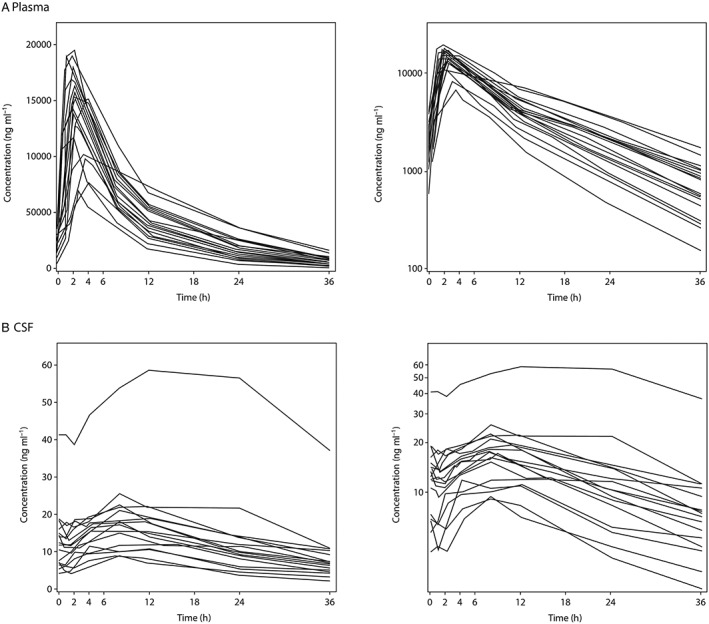
Figure 3.

Individual subject LBQ657 concentrations vs. time on day 14 following oral administration of LCZ696 at 400 mg once daily, (A) plasma and (B) cerebral spinal fluid. Left‐hand graph of each panel is a linear plot with an expanded time scale, right‐hand graph of each panel is a semi‐logarithmic plot
