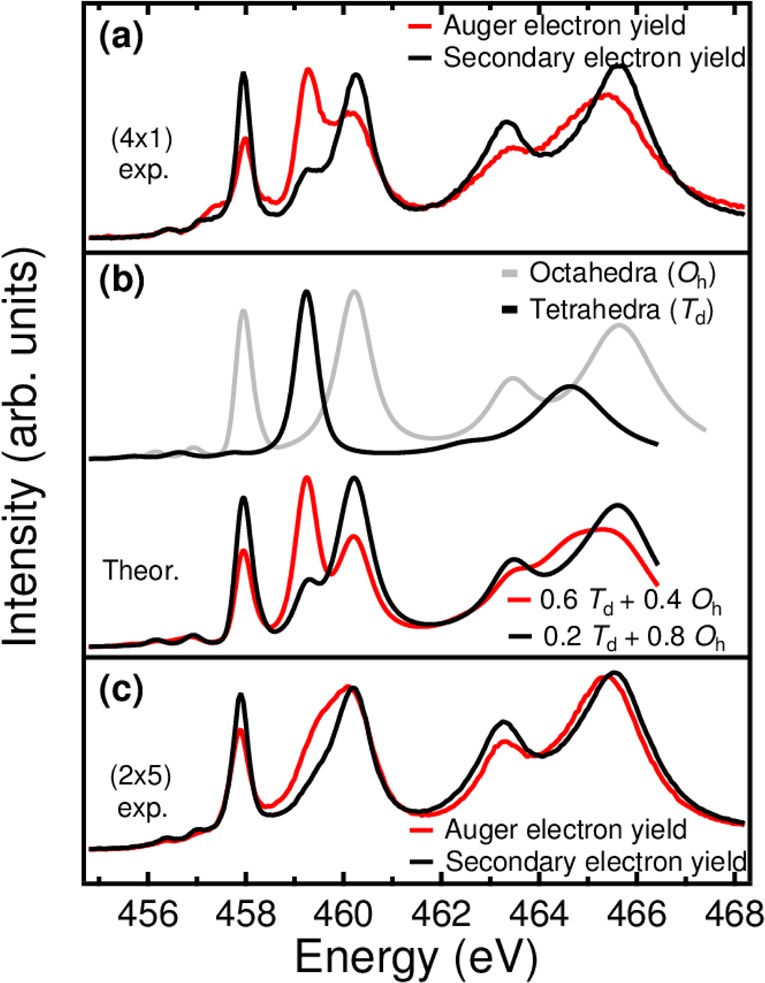
Figure 2.

Ti L2,3 XAS on the 4 × 1 and 2 × 5 surface. (a) Experimental Ti L2,3 XAS measured with AEY (red curve) and SEY (black curve) mode, respectively. (b) Simulated Ti L2,3 XAS of Ti ions in octahedra (Oh) (gray) and tetrahedra (Td) (black) coordination. The low panel shows the spectra with combination of Oh and Td. (c) Experimental Ti L2,3 XAS measured with AEY (red) and SEY (black) electron yield on the 2 × 5 surface.
