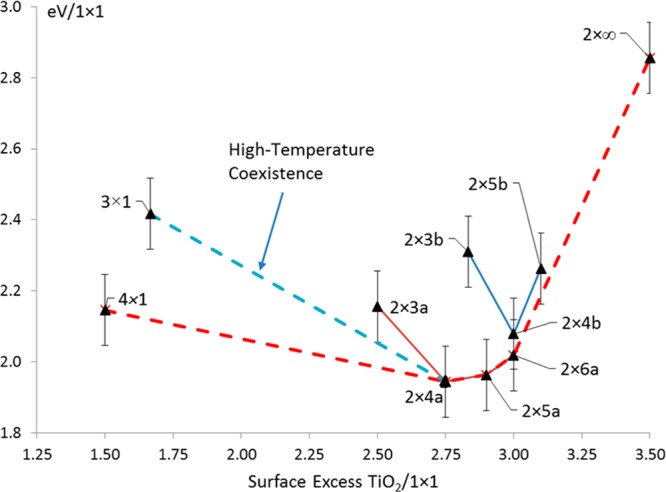
Figure 4.

Convex-hull construction (red) of the surface enthalpies in eV/1 × 1 (y-axis) for different TiO2 excess per 1 × 1 unit cell (x-axis), revTP SSh functional. Error bars are 0.1 eV/1 × 1 cell. Lines are shown for the 2 × na and 2 × nb families, as well as the 2-phase coexistence (blue dashes) between the 3 × 1 and 2 × 4a structures observed for the samples prepared at higher temperatures.13
