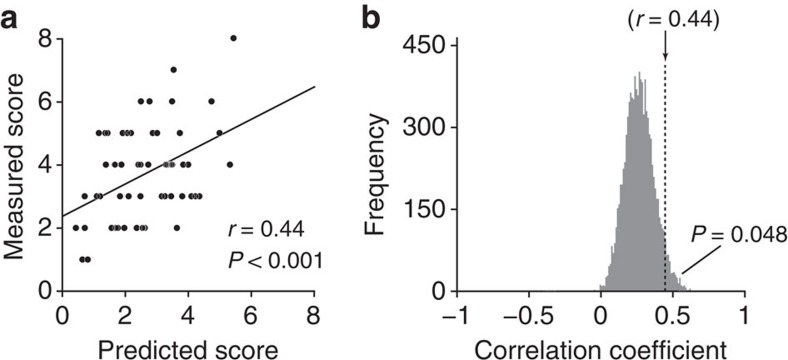
Figure 4. Prediction of ADOS A domain score (communication) using the 16 FCs identified in the classifier.
(a) Scatter plot of the measured ADOS A domain versus the predicted score, which was computed as a linear weighted summation of the 16 FCs identified by the ASD/TD classifier. Each dot represents individual data (n=58, see Methods, Participants). The line indicates the linear regression of the measured score from the predicted score, and correlation coefficient and statistical significance are shown (see Supplementary Table 3 for results of the other three domains of ADOS and all four domains of the ADI-R instrument). (b) The frequency of the different correlation coefficient values is plotted in a bootstrap analysis in which 16 FCs were randomly selected from all 9,730 FCs, with the exception of those 42 FCs selected in the LOOCV procedure. The correlation coefficient between the measured and predicted scores was computed as in a. This analysis indicates that the probability of obtaining the correlation coefficient r=0.44 was small (P=0.048), and demonstrates that the 16 FCs identified in the classifier specifically contain information useful to predict the ADOS A score.

