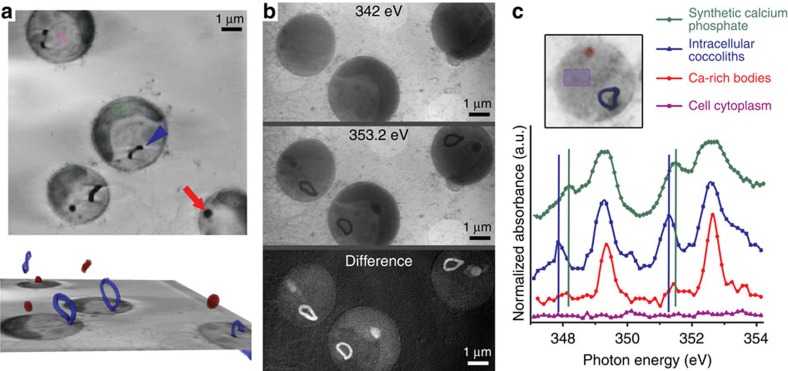
Figure 2. Cryo-X-ray imaging reveals concentrated calcium pools in E. huxleyi cells.
(a) Two-dimensional slices from a reconstructed X-ray tomogram with (top) an immature coccolith marked by the arrowhead and a calcium-rich body marked by the arrow, and (bottom) with 3D segmentation of the calcium-rich bodies (red) and intracellular coccoliths (blue). (b) X-ray images recorded at an energy below the Ca L2,3-egde (342 eV), at the edge energy (353.2 eV) and the grey value difference between both images. (c) Averaged XANES spectra of the Ca L2,3-edge. For each spectrum, data from the relevant pixels of four cells were averaged; the inset shows the exact locations in one of these cells. Notice the difference in the position of the crystal field peak (vertical lines) between coccolith calcite and synthetic calcium phosphate. Figure is accompanied by Supplementary Movie 1.

