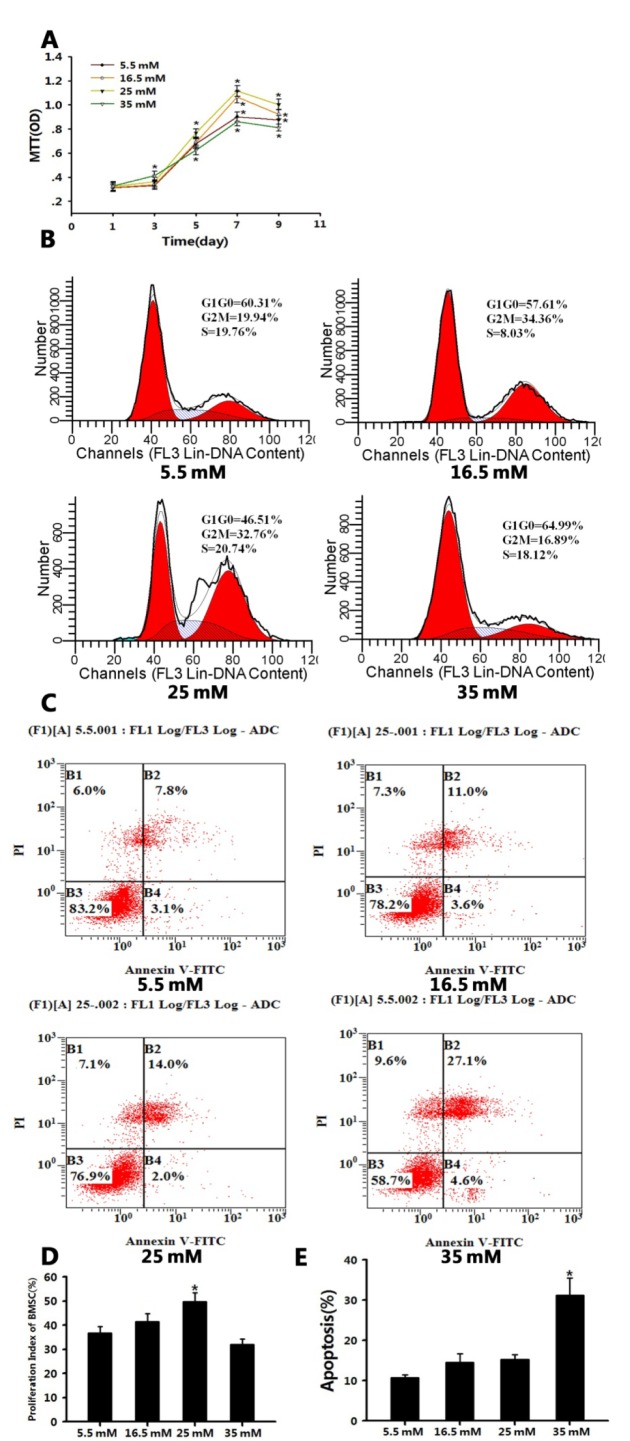
Figure 1. Figure 1: Different concentrations of high glucose had different effects on BMSC proliferation.
A: High-glucose microenvironments (16.5 and 25 mM) promoted BMSC proliferation. Another high-glucose environment (35 mM) inhibited BMSC proliferation. Values are the mean ± SD for triplicate samples from a representative experiment. Student's t-test was performed to determine statistical significance. *P < 0.05
B, D: Flow cytometry analysis of the cell cycle showing that 25 mM glucose had the best effects on BMSC proliferation than the other three glucose concentrations. One-way ANOVA was performed to determine statistical significance. *P < 0.05
C, E: Annexin V-FITC conjugated to PI by flow cytometry showed that 35 mM glucose caused more significant cell apoptosis than the other three glucose concentrations. One-way ANOVA was performed to determine statistical significance. *P < 0.05

