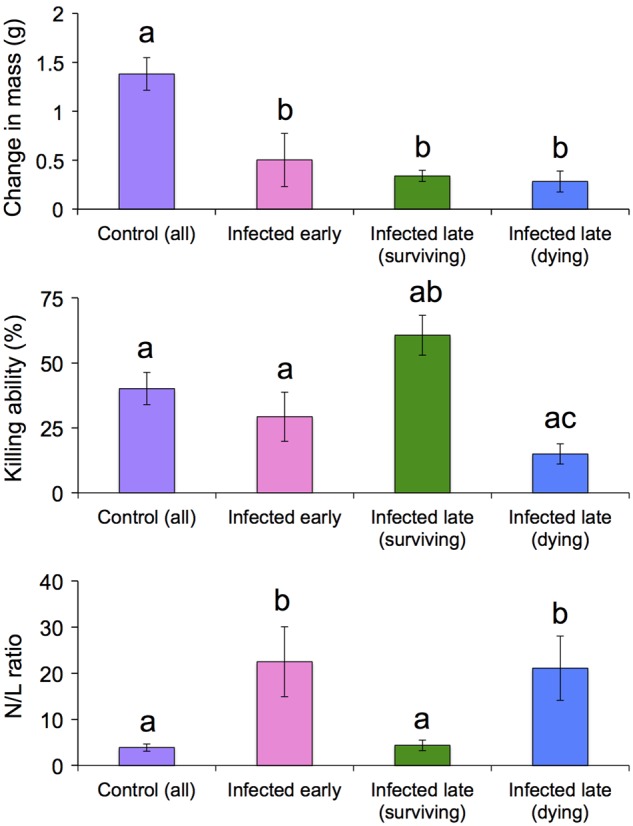
Figure 3:

Physiological metrics among frogs exposed to Batrachochytrium dendrobatidis (Bd) and uninfected control frogs euthanized at early time points [1–15 days post-infection (DPI)] compared with late time points (29–55 DPI). Sample sizes vary among these metrics owing to lack of growth data for week 1 and limited blood volumes for many frogs. Top panel: change in mass in control frogs (n = 26), Bd-exposed frogs euthanized 1–15 DPI (n = 13) and Bd-infected frogs surviving 29–55 DPI with (n = 10) or without (n = 19) signs of chytridiomycosis. Middle panel: bacterial killing ability (BKA) of blood plasma from control frogs (n = 26), Bd-exposed frogs euthanized early (1–15 DPI, n = 18) and Bd-infected frogs surviving 29–55 DPI with (n = 10) or without (n = 17) signs of chytridiomycosis. Bottom panel: ratios of circulating neutrophils to lymphocytes (N/L) in control frogs (n = 12), Bd-exposed frogs euthanized early (1–15 DPI, n = 8) and Bd-infected frogs surviving 29–55 DPI with (n = 6) or without (n = 12) signs of chytridiomycosis. Groups with different letters represent statistically significant differences (P < 0.05). All values are shown ±SEM.
