
Figure 3.
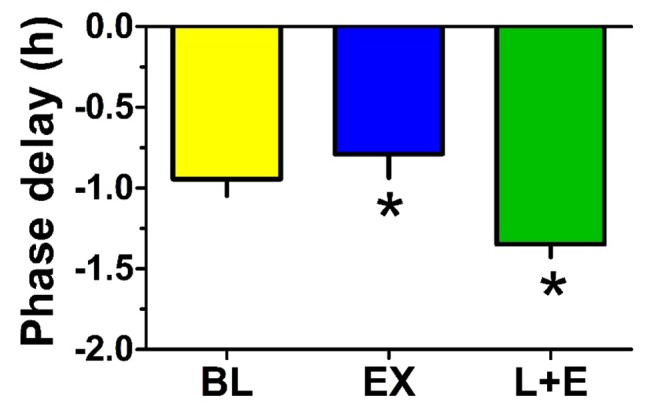
Phase delays in aMT6s acrophase were greatest with light followed by exercise. The bar graph contrasts the group mean (-SEM, n = 6) phase delay shifts observed in aMT6s rhythm 24-h cosine acrophases determined pre- vs. post-stimulation in the three treatments [Bright Light (BL); Exercise (EX); and Bright Light + Exercise (L+E)]. ANOVA revealed that the phase delay following L + E was significantly greater than that following EX. Other comparisons were not significant.