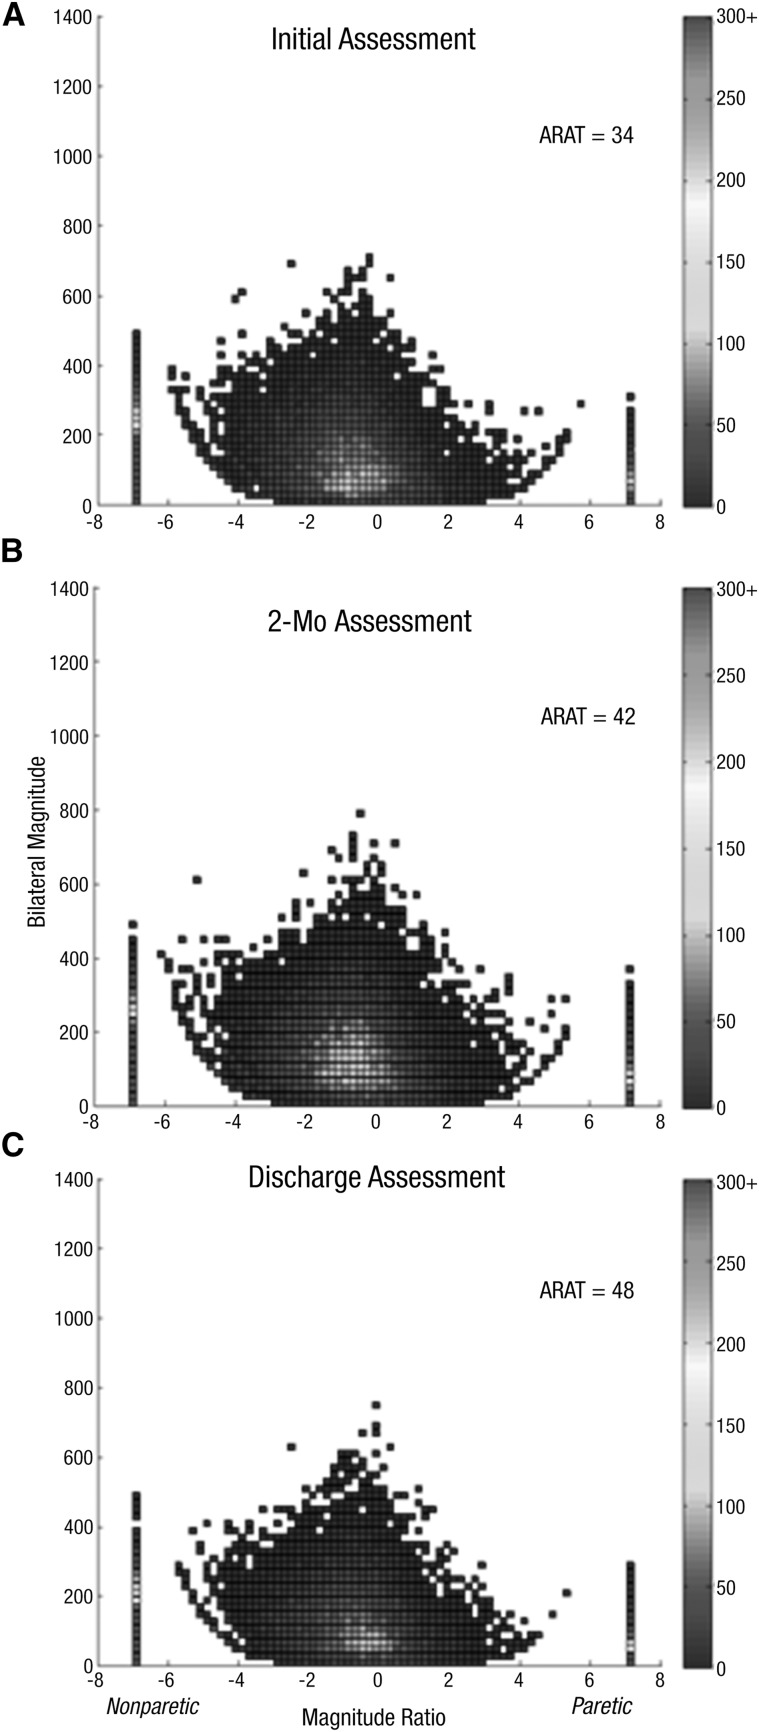
Figure 2.
Density plot showing 24 hr of UE performance in daily life for Participant 3, who showed a change in UE capacity and no change in UE performance: Initial assessment (A), 2-mo assessment (B), discharge assessment (C).
Note. On the x-axis is the magnitude ratio (the contribution of each UE to an activity); on the y-axis is the bilateral magnitude (intensity of movement across both UEs). The color represents the frequency of movement; cooler colors represent lower frequencies (less time), and warmer colors represent higher frequencies (more time). ARAT = Action Research Arm Test; UE = upper extremity.

