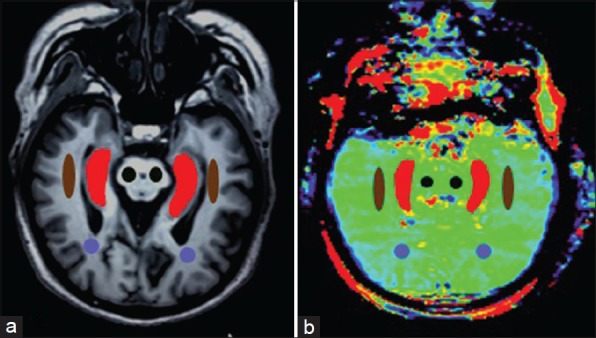
Figure 1.

T1-weighted image (a) and amide proton transfer image (b) were oblique axial planes along the long axis the hippocampi (Hc). Examples of the definition of the regions of interest for quantitative analysis (Brown: Temporal white matter; Purple: Occipital white matter; Black: Cerebral peduncle; Red: Hc).
