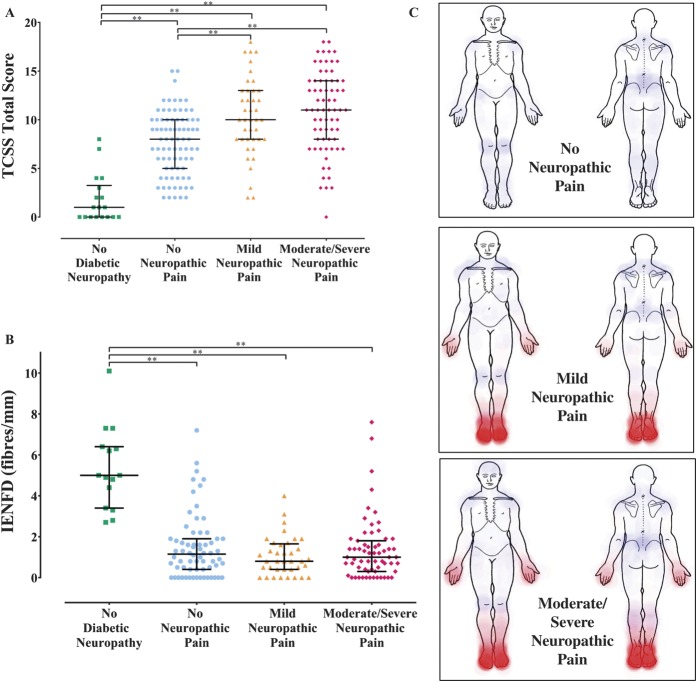
Figure 3.
(A) Scatter plot and median (interquartile range [IQR]) of Toronto Clinical Scoring System (TCSS) scores for study participants with no peripheral diabetic neuropathy, and diabetic neuropathy with no neuropathic pain (NeuP), mild NeuP, moderate/severe NeuP. Kruskal–Wallis, Dunn multiple comparison test: **P < 0.01. (B) Scatter plot and median (IQR) of intraepidermal nerve fibre density (IENFD) from the distal leg for study participants with no peripheral diabetic neuropathy, and diabetic neuropathy with no NeuP, mild NeuP, moderate/severe NeuP. Intraepidermal nerve fibre densities were determined for 182 (87%) study participants. Kruskal–Wallis, Dunn multiple comparison test: **P < 0.01. (C) Heat maps obtained from the 7-day pain diary demonstrating the areas of NeuP (in red) and non-NeuP (in blue) within the study participants with diabetic neuropathy and no NeuP, mild NeuP, and moderate/severe NeuP.

