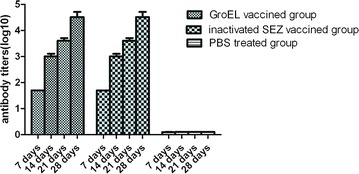
Figure 3.

Antibody response following vaccination. Three mice from each group were sampled at random on each date. Data represent the mean ± standard deviation (n = 3 per group) of antibody titers (log 10) vs. days post-vaccination. Bars indicate standard deviations. The antibody titers of the rGroEL protein-vaccinated mice were significantly higher (P < 0.01) than those of the PBS-injected mice at all time points post-vaccination. No significant differences in titers were found between the rGroEL protein-vaccine and the inactivated S. equi spp. zooepidemicus vaccine (P > 0.05).
