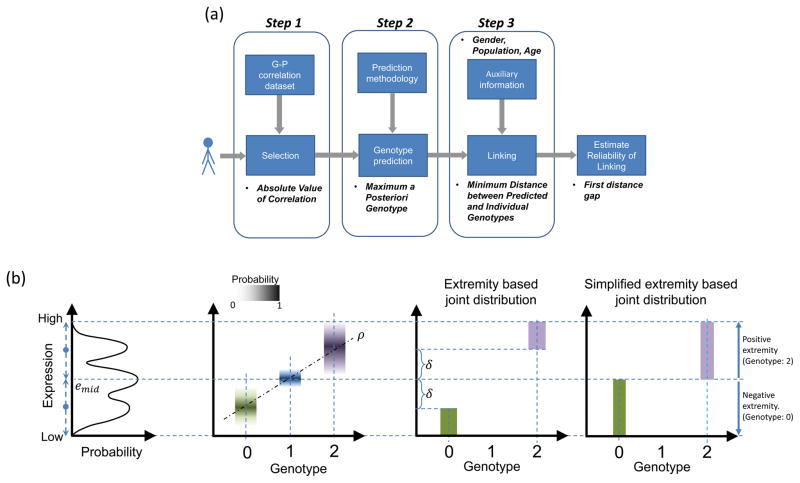
Figure 4.
Illustration of genotype-expression associations and linking attacks (a) Illustration of the three step linking process: selecting phenotypes and genotypes to be used in linking (step one), predicting the genotypes (step two), linking predicted genotypes to the genotype dataset (step three). The attacker can also estimate the reliabilities of the linkings using the first distance gap metric. (b) Schematic representation of expression-genotype relationships and simplifications. The trimodal gene expression distribution and the joint genotype-expression distribution are shown. The conditional distribution of expression given each genotype is illustrated with box plots in different colors corresponding to each genotype. The genotypes and expression levels are correlated (ρ) as indicated by the line fit. In the extremity-based joint distribution, when the genotype value is 0, a uniform probability is assigned for expression values where extremity is smaller than δ (Green rectangle). For a genotype value 1, no probability is assigned. When genotype value is 2, the probability is uniformly distributed over expression values for which extremity is greater than δ (Purple rectangle). Simplified extremity-based model utilizes the same distribution by setting δ to 0. In this case, when genotype is 0, joint probability is distributed uniformly over expression levels with negative extremity (Green rectangle). When genotype is 2, uniform probability is assigned to expression levels with positive extremity (Purple Rectangle).

