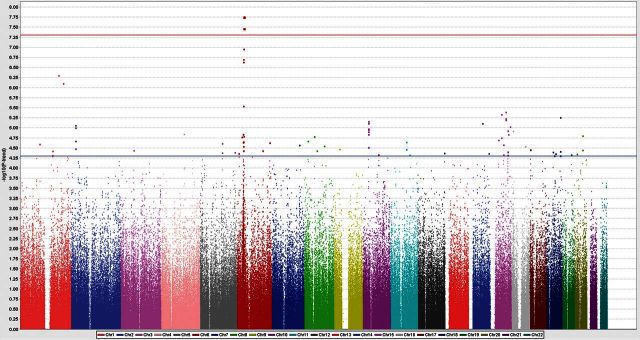
Figure 1.
Manhattan plot showing the genome-wide P-values of association. The P-values were calculated by Cochran–Armitage trend test. The y-axis represents the −log10 P-values of 554 389 SNPs, and x-axis shows their chromosomal positions. The horizontal blue line shows the threshold of P ≤ 5 × 10⁻⁵ for selecting 84 SNPs for replication analysis.

