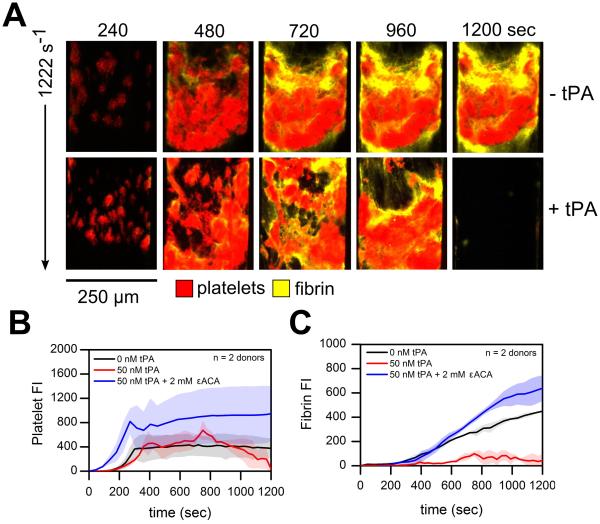
Figure 4. Platelet and fibrin accumulation in response to exogenous tPA ± εACA at arterial shear rates.
(A), Overlay of platelets (red) and fluorescent fibrinogen (yellow) deposition at 1222 s−1 over the time course of the 20 min assay. (B), Platelet fluorescence intensities vs. time with exogenous tPA ± εACA. (C), Fibrin fluorescence intensities vs. time with exogenous tPA ± εACA. Shaded traces are the mean and standard deviation of 8 clotting events from 2 donors.

