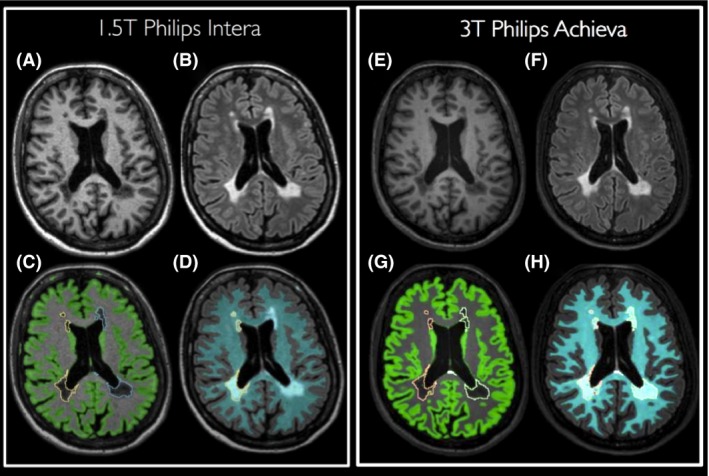
Figure 2.

Visualization of MSmetrix segmentation results for the 1.5T (A–D) and 3T (E–H) scan of a randomly selected MS patient. T1 scans are shown in (A) and (E), FLAIR scans in (B) and (F). Lesion and GM segmentations are superimposed on the T1 scan, as displayed in (C) and (G). Finally, lesion and WM segmentations are visualized on the FLAIR scan in (D) and (H).
