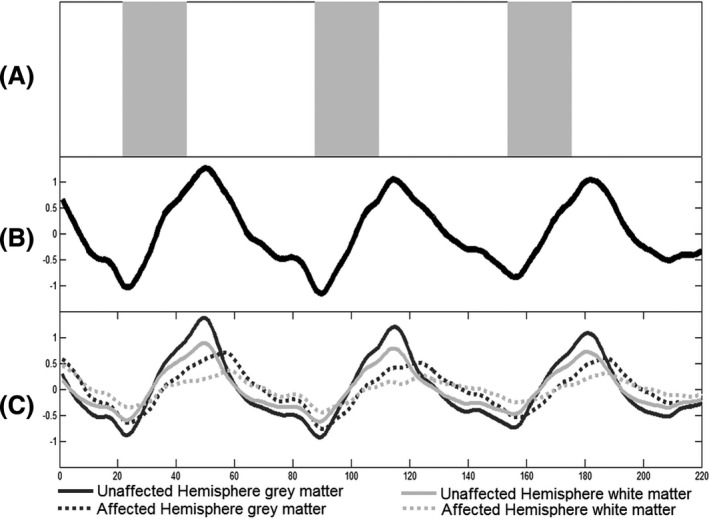
Figure 1.

Breath‐hold paradigm and BOLD time series. (A) Breath‐hold paradigm presented as a taskbar. The gray blocks indicate the three breath hold periods of 22 TR (44 sec). The white blocks, amidst, represent the resting periods of 44 TR each, except for the first one: 22 sec. Total duration of this protocol is 7:20 min. (B) Illustrative whole brain combined gray and white matter BOLD time series of one subject. The time series is displayed over the period of 220 repetition times (TR) (440 sec). (C) Hemispheric mean BOLD time series of gray and white matter. The time courses of the unaffected hemisphere are illustrated with a bold line, whereas the affected hemisphere time courses are displayed with a dotted line. The dark lines indicate gray matter, whereas gray lines indicate the white matter. As expected, the unaffected hemisphere reacts to a greater extent to the given stimulus than the affected hemisphere, as does the gray matter compared to the white matter. The time to reach signal maximum is also faster in the unaffected hemisphere, which results in different phase between hemispheres.
