. 2016 Jan 25;6(2):e00426. doi: 10.1002/brb3.426

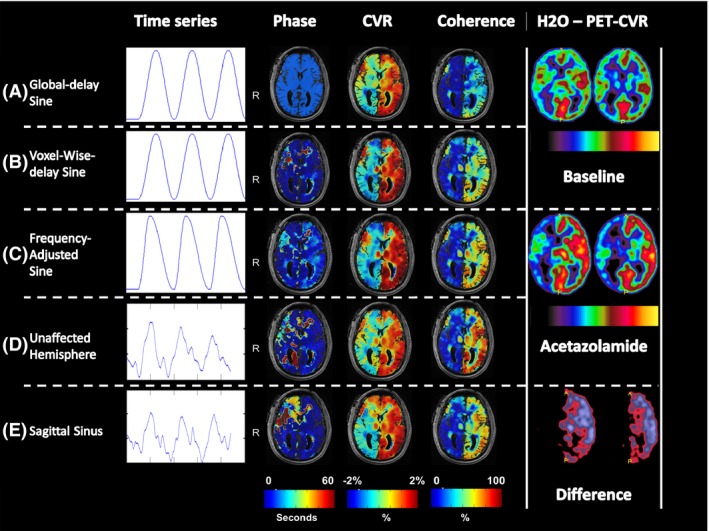
Figure 2.

Figure 2

Illustrative models and phase, CVR, and coherence maps of one subject (male: 65 years old) with right ICA occlusion and right‐sided unilateral hemodynamic impairment on H2O‐PET imaging. The color scales are displayed below the maps. For the phase maps, the scale ranges from 0 to 60 sec. The CVR maps of the sine models display the % BOLD signal change and are ranged from −2 and 2%, whereas the “Optimal Signal” models represent the % BOLD signal change per percent optimal BOLD time series and are also ranged from −2 to 2%. The coherence maps show the measurement of the amount of variance explained with the given model between 0–1. Abbreviations: CVR, cerebrovascular reactivity; ICA, internal carotid artery; PET, positron emission tomography; TR, repetition time.