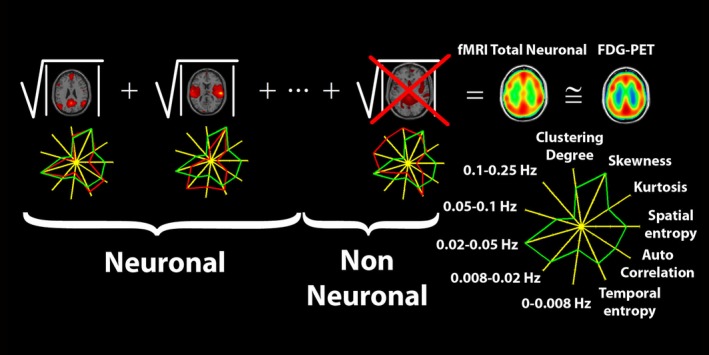
Figure 1.

Pictorial description of the methodology used to construct the fMRI total neuronal scalar map starting from automatically selected neuronal independent components. Neuronal independent components were selected based on their fingerprint, which describes for each component, spatial properties of the distribution of the Z scores as extracted from the spatial map and temporal properties as extracted from the corresponding time course. The green line on the fingerprint represent the mean values obtained from an independent group of normal volunteers, the red line represents the values observed in the assessed subject.
