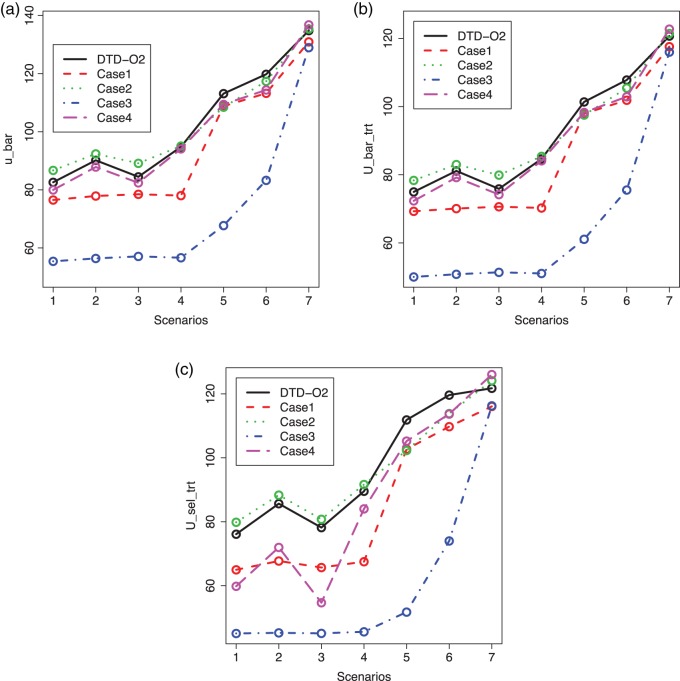
Fig. 2.
Plots of  for a comparison of DTD-O2 vs. a design with binary outcomes. Here,
  ,
,  , and
, and  represent empirical mean utilities of patients treated in the trial, true mean utilities of treatments given to patients in the trial, and true expected utilities chosen for future patients, respectively. (a)
  . (b)
. (b)  . (c)
. (c)  .
.

