Figure 2.
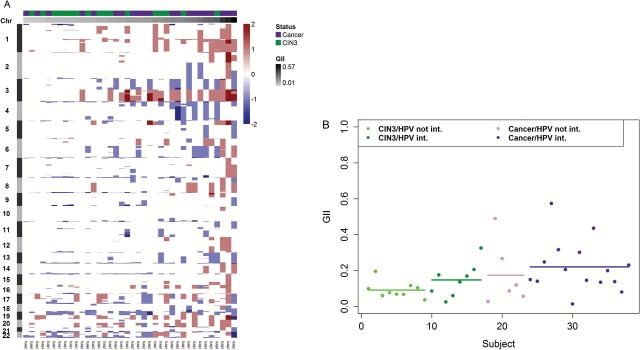
Genomic instability index (GII) for CIN3 and cancer samples. (A) Heatmap of copy number alterations of 250 000 probes that were randomly selected for illustration purposes. Red represents gains and blue represents losses. Columns are samples and rows are positions of the probes along the 22 autosomes. The top column track indicates the diagnosis of the sample (CIN3 versus cancer) and the bottom column track provides the GII score. Samples were ordered according to their GII value. (B) GII values for each subject according to the diagnosis and integration status. Dots indicate individual values and lines are mean values.

