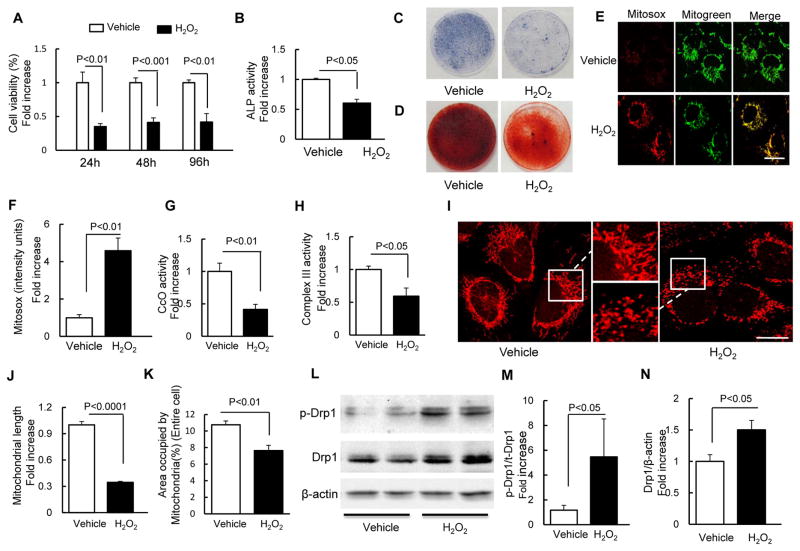
Fig. 1.
H2O2 induced osteoblast dysfunction. (A) Cell viability determined by MTT reduction in osteoblasts in the presence of H2O2. (B) ALP activity tested in osteoblasts as indicated groups. Data are expressed as fold increase relative to vehicle-treated cell. (C) ALP and (D) Alizarin red staining of osteoblasts in the indicated treatment groups. (E) Representative images with Mitosox staining. Mitogreen staining was used to show mitochondria (Scale bar = 10 μm). (F) Quantification of staining intensity for Mitosox staining. CcO activity (G) and Complex III activity (H) were measured in the indicated groups of cells. (I) Representative images for Mitotracker red staining to reveal mitochondrial morphology. The middle panel is a larger image corresponding to the indicated image on the left and right one (Scale bar = 5 μm). (J–K) Quantification of mitochondrial morphology in regard to mitochondrial length (J) and density of area occupied by mitochondria (K). (L) Representative immunoblots of phospho-Drp1 (p-Drp1) and total Drp1 (Drp1).(E–F) Quantification of immunoreactive bands for p-Drp1 relative to Drp1(M), Drp1 relative to β-actin(N) in osteoblast in the presence of H2O2 or vehicle treatment using NIH Image J software. Date are expressed as fold increase relative to vehicle treated cell.

