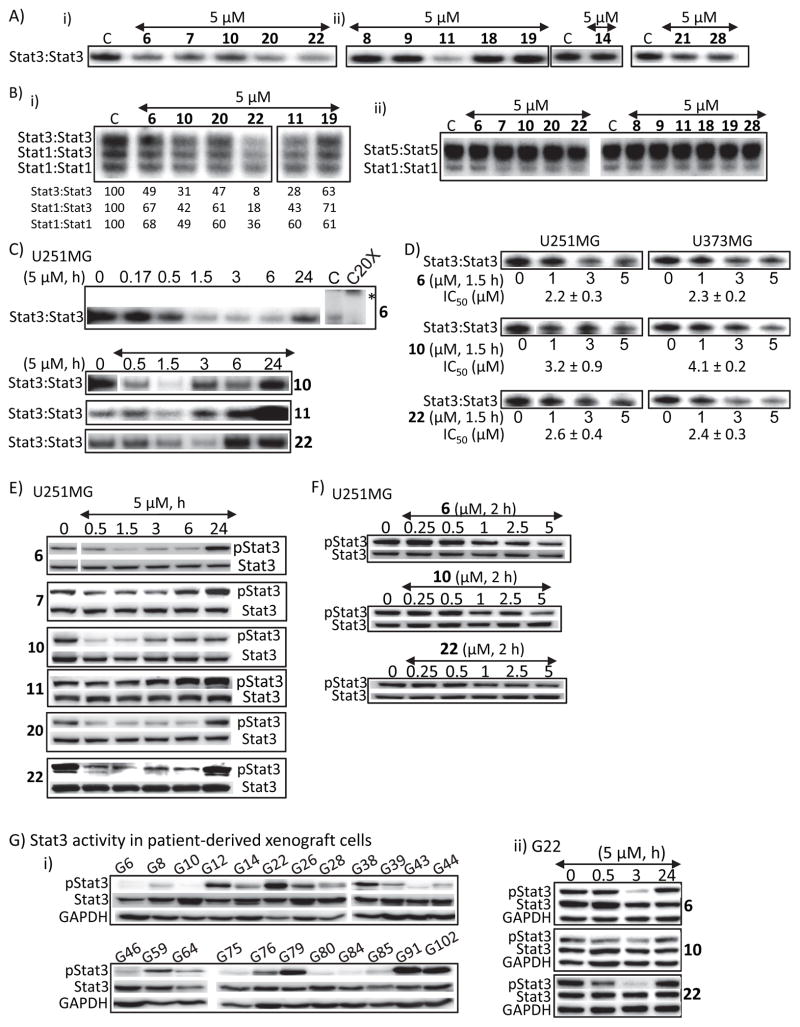
Figure 2. Hirsutinolide natural products inhibit Stat3 activation.
(A and B) Nuclear extracts containing activated (A) Stat3 from NIH3T3/v-Src fibroblasts or (B) Stat1, Stat3 and Stat5 from EGF-stimulated NIH3T3/hEGFR were pre-incubated with the designated hirsutinolides for 30 min at room temperature prior to incubating with the radiolabeled hSIE probe that binds Stat1 and Stat3 or MGFe probe that binds Stat1 and Stat5 and performing EMSA analysis; bands corresponding to STAT:DNA complexes in gel were quantified using ImageQuant and represented as percent of control (B (i), lower panel); (C and D) Stat3 DNA-binding activity with EMSA analysis using the hSIE probe that binds Stat3 of nuclear extracts prepared from U251MG or U373MG cells treated with the designated hirsutinolides at (C) 5 μM for 0–24 h or (D) 0–5 μM for 1.5 h; (E–G) Immunoblotting analysis of whole-cell lysates prepared from (E and F) U251MG cells treated with the designated hirsutinolides at (E) 5 μM for 0–24 h or (F) 0–5 μM for 2 h, or (G) human glioma patients-derived xenograft cells (i) G6-G102, untreated, or (ii) G22, treated with 5 μM for 0–24 h 6, 10, or 22 and probing for pStat3, Stat3 or GAPDH. Positions of proteins or DNA-bound STATs in gel are labeled; control lane (c, 0) represents whole-cell lysates or nuclear extracts prepared from 0.025% DMSO-treated cells or nuclear extracts pre-treated with 0.025% DMSO. Bands corresponding to Stat3:DNA complexes were scanned and quantified using ImageJ, plotted against concentration of agent from which IC50 values were derived. Data are representative of 2–3 independent determinations. *Position of supershifted complex.

