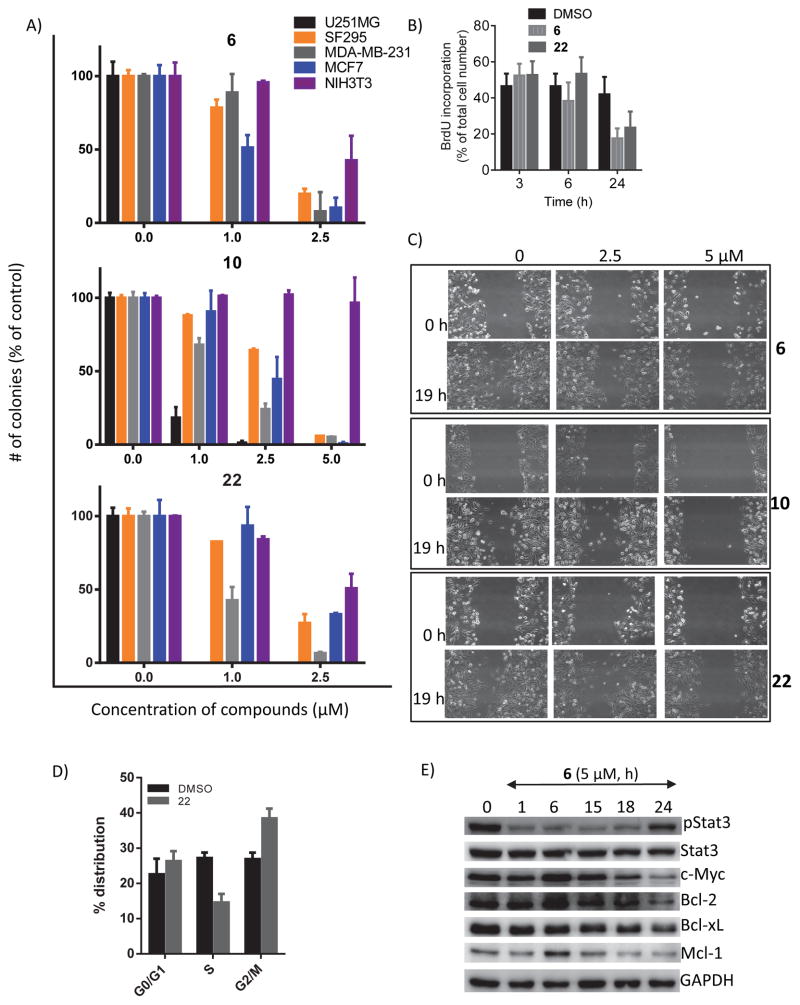
Figure 5. Hirsutinolides inhibit in vitro cell proliferation, colony survival, and migration, and the expression of Stat3-regulated genes.
(A) Single-cell cultures of U251MG, SF295, MDA-MB-231, MCF7 and NIH3T3 cells treated once with 0–5 μM 6, 10 or 22 and allowed to grow until large colonies were visible, which were stained with crystal violet, counted and plotted. U251MG colony formation was completely inhibited by 1 μM 6 or 22; (B) 5-bromo-2′-deoxyuridine (BrdU) incorporation analysis for proliferating U251MG cells treated with 0 or 5 μM 6 or 22 for 3–24 h. Images were captured under a fluorescence microscope and analyzed with ImageJ software; (C) cultured U251MG cells were wounded, treated once with 0–5 μM 6, 10 or 22 and allowed to migrate to the denuded area over 19 h and imaged; (D) cell cycle distribution analysis of U251MG cells treated or untreated (DMSO) with 15 μM Cmpd1 for 24 or 72 h, processed by propidium iodide (PI) staining, and analyzed by flow cytometry for DNA content, which is plotted; and (D) immunoblots of pStat3, Stat3, c-Myc, Bcl-2, Bcl-xL, Mcl-1 or GAPDH from whole-cell lysates from U251MG cells treated with 5 μM 6 for 0–24 h. Positions of proteins in gel are shown; control lane (0) represents 0.025% DMSO-treated cells or whole-cell lysate preparation from 0.025% DMSO-treated cells. Values are the mean ± S.D., n=3–6. Data are representative of 2–3 independent determinations.

