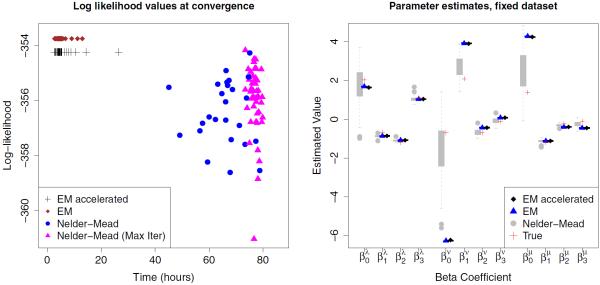
Figure 4.
The left plot shows converged log-likelihood values using EM, accelerated EM, and Nelder-Mead optimization. The right plot shows parameter estimates produced by the EM, accelerated EM, and Nelder-Mead algorithms, with true parameters values shown as crosses. This figure appears in color in the electronic version of this article.

