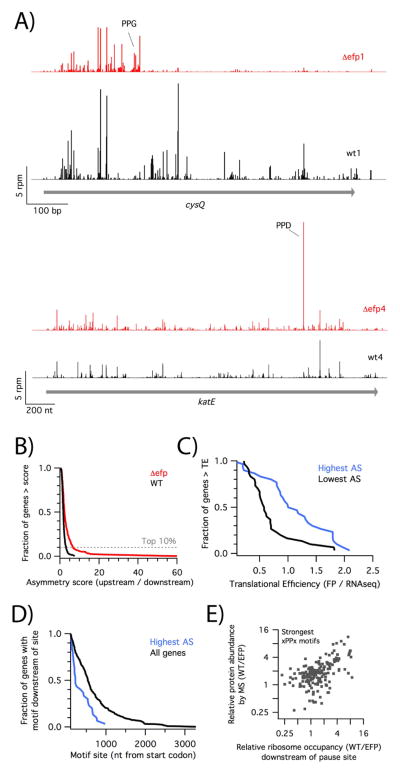
Figure 4.
Reduced ribosome density downstream of pause sites. A) Ribosome occupancy on the cysQ and katE genes in wild-type (black) and efp mutant data (red). B) For a subset of 300 genes containing strong pausing motifs, we calculated an asymmetry score (AS), the density upstream of the pause divided by the density downstream. The fraction of genes above a given AS is plotted for the combined four wild-type (black) or efp mutant datasets (red). C) For 30 genes with the highest or lowest AS in the efp knockout, we plotted the fraction of genes with more than the given translational efficiency. D) For 30 genes with the highest AS in the efp knockout, the fraction of genes with the pausing motif after a specific position was plotted. E) Correlation of the relative protein abundance in MS data vs the relative ribosome occupancy downstream of the pause site for genes with strong pausing motifs. See also Figure S2 and Table S3.

