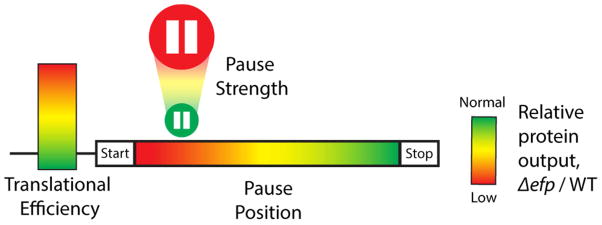
Figure 5.
Three factors that determine how pausing affects protein output. Translational efficiency is represented by a scale of low to high initiation levels; pause strength by the size of the pause button; and 5′-polarity by the position along the gene. Red represents reduced protein levels and green represents normal levels in the efp mutant.

