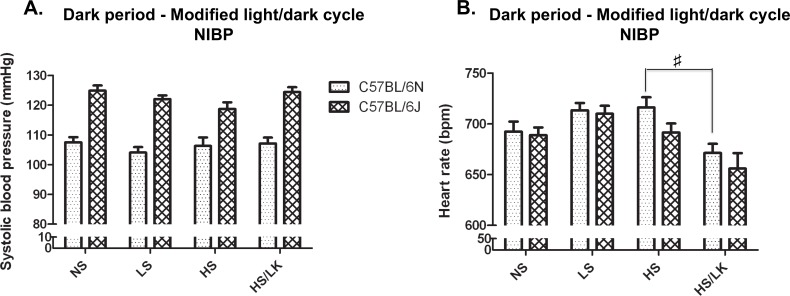
Fig 5. Comparison between C57BL/6N and C57BL/6J for their systolic blood pressure and heart rate responses to various salt challenges measured by NIBP.
Measurements were made during the dark periods of a modified light/dark cycle. NS = normal salt diet (n = 20 and n = 20, for C57BL/6N and C57BL/6J respectively), LS = low salt diet (n = 20 and n = 20, for C57BL/6N and C57BL/6J respectively), HS = high Na+/normal K+ diet (n = 9 and n = 10, for C57BL/6N and C57BL/6J respectively) and HS/LK = high Na+/low K+ diet (n = 9 and n = 10, for C57BL/6N and C57BL/6J respectively). One-way ANOVA per light phase followed by Tukey Kramer’s post-hoc test; #: p<0.05 HS/LK compared to HS.

