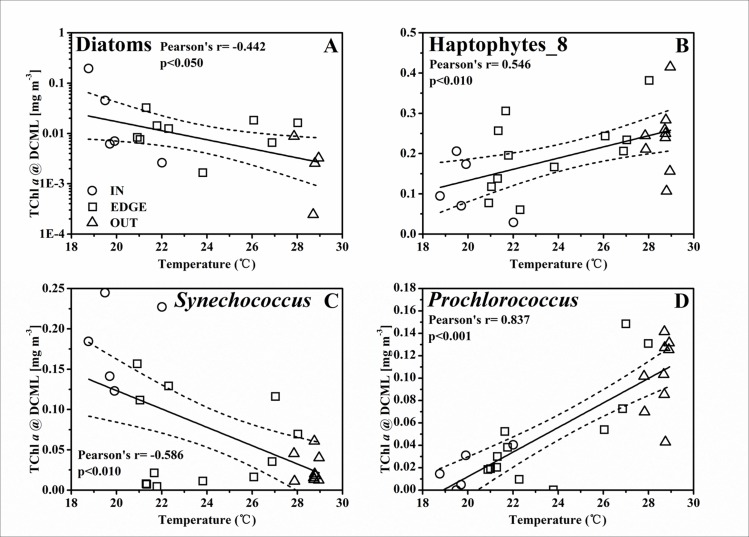
Fig 10.
The linear relationship between the TChl a biomass at the DCML of (A) diatoms [mg m-3], (B) haptophytes_8 [mg m-3], (C) Synechococcus [mg m-3], (D) Prochlorococcus [mg m-3] and the temperature at the 50 m depth layer. The solid line and two dashed lines are the same as in Fig 8.

