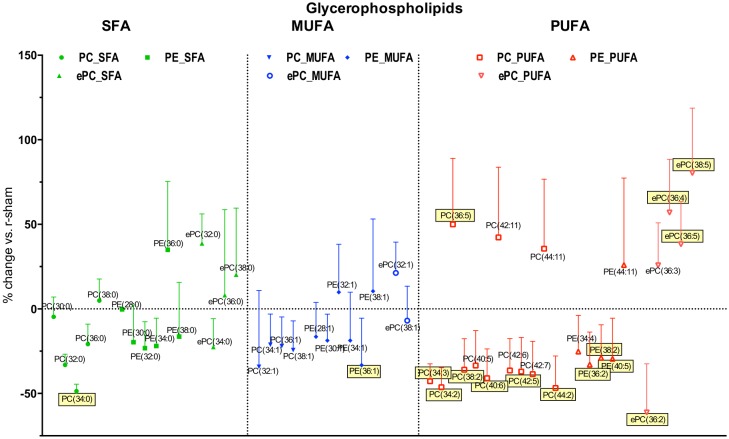
Fig 8. Effect of r-mTBI on diacyl-glycerophospholipid species detected in the present study based on degree of unsaturation.
Saturated fatty acid species (SFA) are presented in green, monounsaturated fatty acid species (MUFA) are presented in blue, while polyunsaturated fatty acid species (PUFA) are presented in red. Symbols represent mean values of percent change of r-mTBI samples compared to r-sham samples; error bars indicate SEM. Note 1: due to the large number of PUFA species detected, only the ones showing > ±30% change are presented. Note 2: Species names covered with yellow boxes indicate statistical significance (p<0.05).

