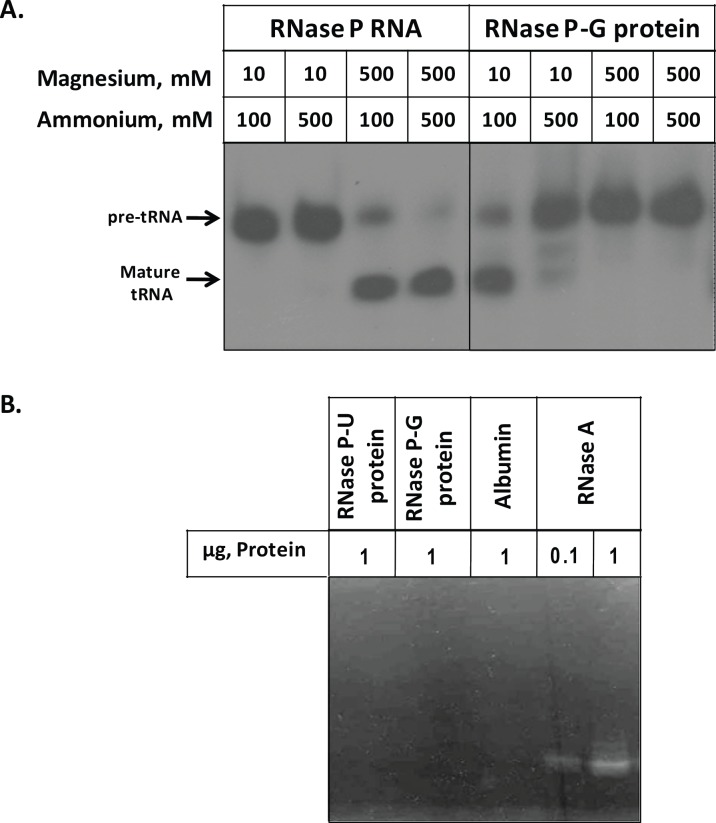
Fig 4. Comparison of pre-tRNA processing by RNase P RNA and RNase P-G protein and zymogram analysis of protein preparations.
A. Indicated concentrations of magnesium and ammonium ions were used to assay the pre-tRNA cleavage by RNase P RNA and RNase P-G protein. The reactions contained 50 nM of RNase P RNA and 100 nM of RNase P-G protein. B. Zymogram analysis of the two protein preparations, albumin and RNase A.

