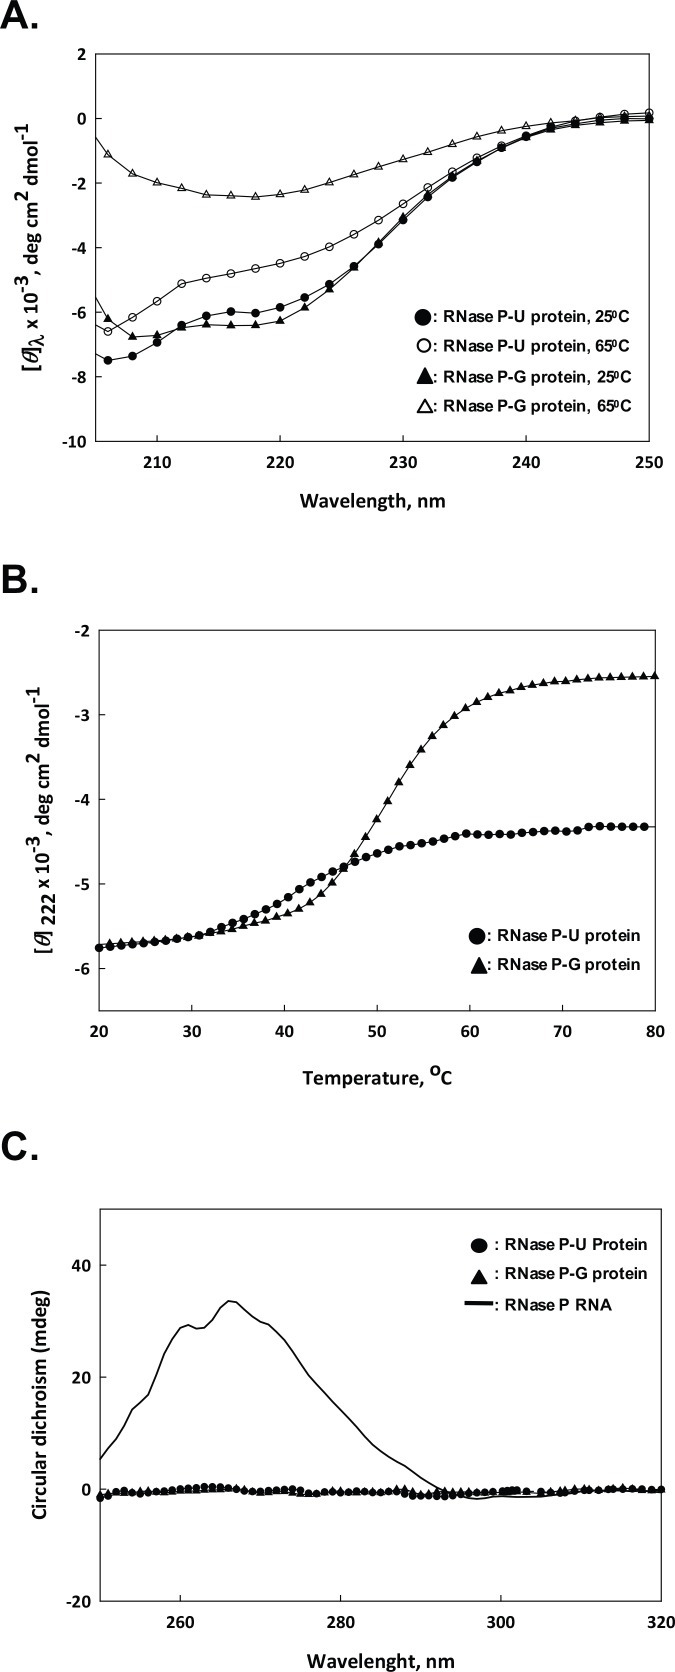
Fig 7. CD spectroscopy of RNase P protein components.
A. Far-UV CD spectra of the two protein preparations from 205–250 nm at different temperatures. B. CD profile of RNase P-U protein and RNase P-G protein within the temperature range of 20–80°C. C. Near-UV CD spectra of RNase P RNA (2 μM), and RNase P-U protein and RNase P-G protein (12 μM each) within 250–320 nm.

