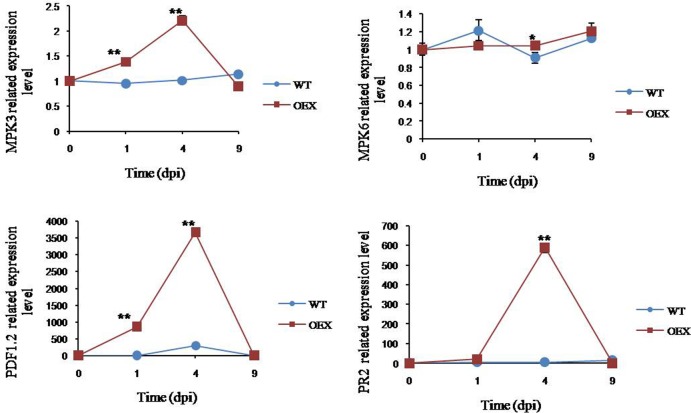
Fig 9. qPCR analysis of gene expression in WT and transgenic GbSBT1 lines after F. oxysporum infection.
Gene expression levels were normalized to the constitutive ACT2 gene expression. Data represent the mean of gene expression levels with SD at different infection stages; n = 3 replicates. dpi: days post-inoculation. Error bars represent the standard deviation for three biological experiments, and three technical replicates were analyzed. Statistical significance was determined using two-tailed unpaired Student’s t-tests, and P values <0.05 were considered statistically significant (** for P values <0.01).

