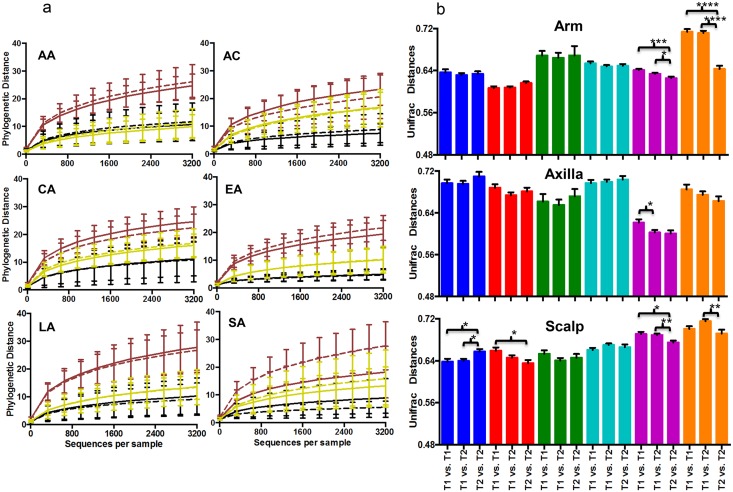
Fig 2. Comparison of diversity of the cutaneous microbiota over time, by ethnic group.
Panel A. Rarefaction analysis of cutaneous microbiota in relation to sampling time in samples from arms (Brown), axilla (Black) and scalp (Yellow), African-American (AA, n = 108 samples); African-Continental (AC, n = 66); Caucasian-American (CA, n = 96); East-Asian (EA, n = 150); Latin-American (LA, n = 114); South-Asian (SA, n = 96). Rarefaction analysis represented by phylogenetic distance. The solid and dashed lines indicate samples collected before (T1) and after (T2) a special soap wash was used, respectively. Only a significant difference between time-points was found for the SA group. Panel B. Intra- and inter-group beta-diversity over time. Mean (±SD) pairwise unweighted UniFrac distances are shown. The ethnic groups are colored as described in Fig 1. Significance was determined by one-way ANOVA with the Tukey method for correction for multiple comparisons (*<0.05; **<0.01; ***<0.001; ****<0.0001).

