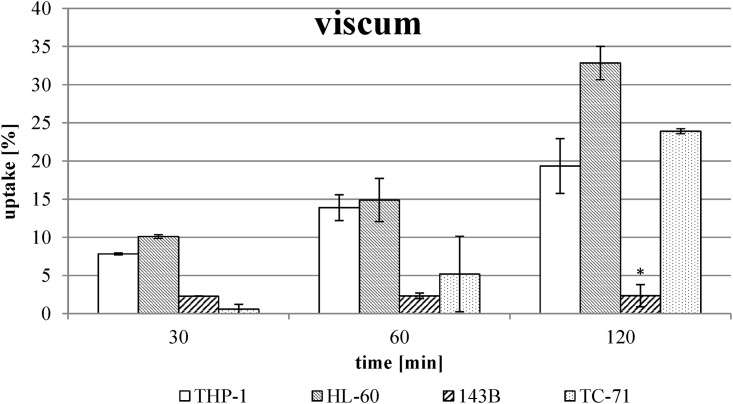
Fig 2. Uptake of ML out of viscum extract without combination with TT extract.
The values were calculated using three viscum extract batches in two different ML concentrations (see Table 2) and are expressed as percentage of respective used concentration. Error bars represent the standard deviation of n ≥ 4 experiments. * Significant difference to the other cell lines, α ≤ 0.05.

