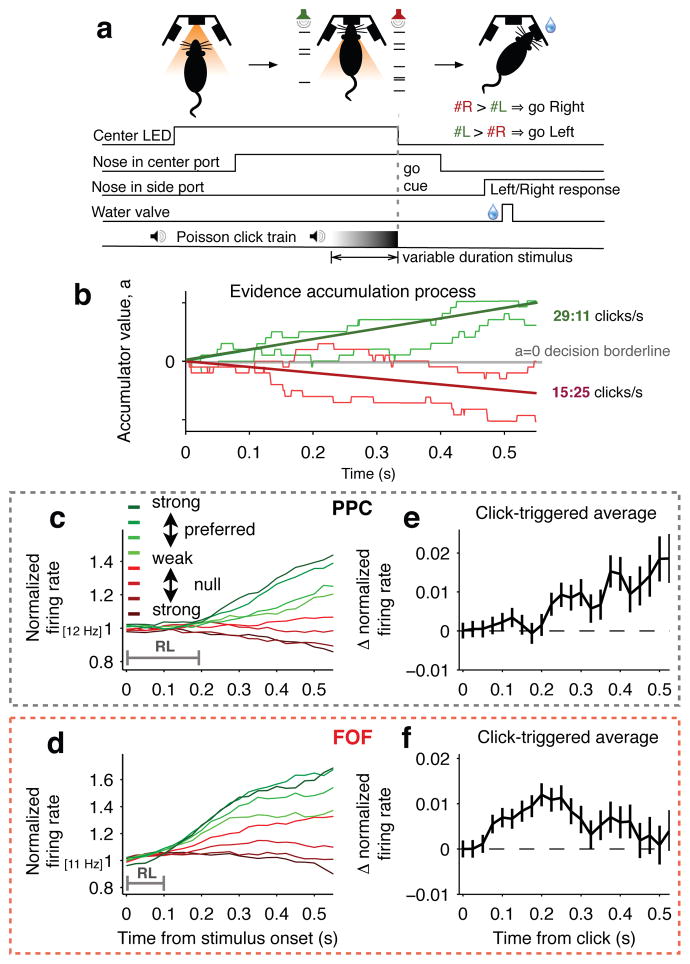
Figure 1. Choice-selective neurons in PPC and FOF exhibit signatures of evidence accumulation.
a, Sequence of events for each trial. b, Schematic of the evidence accumulation process. Each right (left) click provides a single quantum of positive (negative) evidence. The thick green line shows the expected trajectory, averaged over many trials, of the accumulating evidence for a mean stimulus strength of 29:11 clicks/sec. The red line shows this for 15:25 clicks/sec. The lighter-colored traces show how individual trials within a given stimulus-difficulty class meander based on each trial’s variable click times. At the “go” signal (offset of center LED), the sign of a indicates the appropriate decision. c, PPC population responses. Trials were grouped by average strength of the sensory evidence. Green traces correspond to stimuli in the preferred direction of the recorded neurons and red traces to the non-preferred direction. Darker hues correspond to easier trials. Responses exhibit ramping profiles that depend on the mean stimulus strength. The PPC response lag (RL) until stimulus-strength-dependent ramping was ≈200 ms. n = 93 neurons. d, Same as (c) for neurons in the FOF. Similar to PPC, responses exhibit ramping profiles that depend on the mean stimulus strength. RL in the FOF is ≈100 ms. n = 128 neurons. e, Click-triggered average response ± s.e.m. in PPC. f, Same as (e) for FOF.

