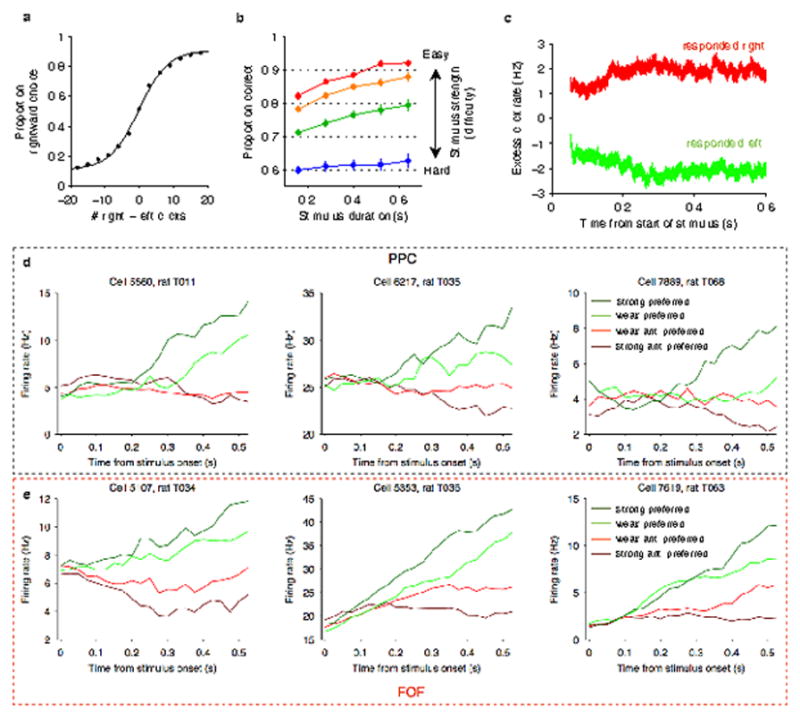
Extended Data Figure 1. Rat behavior and example neurons.

a, Mean psychometric function across all rats. Accuracy was highest for the largest click differences (the left and right endpoints of the curve) and lower for smaller click differences (the middle of the curve). b, Mean chronometric function across all rats. Trials were sorted by binned stimulus strength (difficulty), with mean click ratios ranging from 39:1 clicks/s for the easiest trials to 25:15 clicks/s for the hardest trials. In general, accuracy improved with longer stimulus durations. c, Mean psychophysical reverse correlation across all rats. This was calculated based on trials with minimum duration of at least 0.6 s. For each timepoint in each trial, we first computed the excess click rate difference (right - left clicks/s) relative to the value expected given the random processes used to generate the trial. These excess click rates were averaged separately for trials ending with a right choice (red) and for trials ending with a left choice (green). The separation between the two traces indicates how strongly clicks from the corresponding timepoint influence the final decision. d, Peri-event time histograms (PETHs) aligned to stimulus onset were calculated for 3 example PPC neurons. Trials were sorted into 4 stimulus strength bins for each neuron. Green traces correspond to the preferred-direction stimuli and red traces correspond to anti-preferred-direction stimuli. Darker colors correspond to stronger stimuli (less difficult) and brighter colors correspond to weaker stimuli (more difficult). e, PETHs for 3 example FOF neurons using the same conventions. In both regions, individual neurons exhibit ramping activity that depends on stimulus strength.
