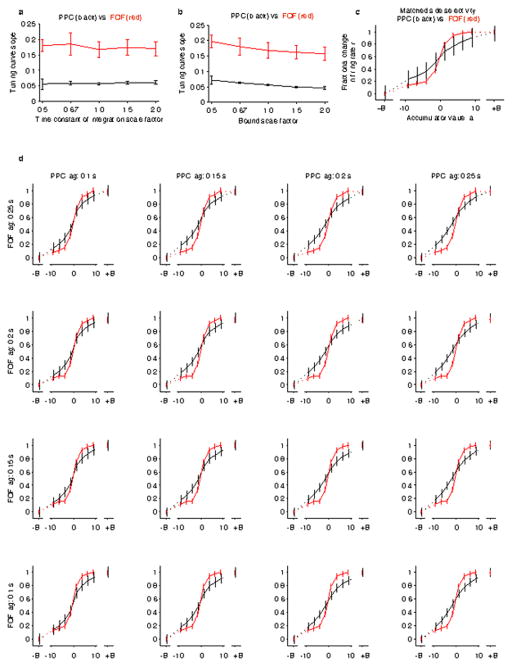
Extended Data Figure 3. Robustness of distinction between PPC and FOF to parameter variation.
a, The distinction between PPC and FOF encoding is robust to variation of the model’s time constant of integration. The slope of the tuning curves, drawn from the same analysis as Figure 3c in the main text, except that here the analysis was carried out at a variety of integration time constants b, Same analysis performed for a variety of heights for the sticky decision-commitment bounds. In both cases, the corresponding best-fit parameter was scaled by the factor shown on the horizontal axis, and the slope of tuning curve for FOF (in red) vs. PPC (in black) was plotted as a function of that scale factor. Error bars show 95% confidence intervals. The slope of the FOF tuning curve is significantly sharper than the slope of the PPC tuning curve across the entire range of parameter values tested (p < 0.05). c, Tuning curve comparison between PPC and FOF with subset of PPC neurons selected such that the two regions have matched side selectivity. This resulted in n = 50 neurons for PPC and the original n = 128 neurons for FOF. The tuning curve is significantly steeper for FOF (p < 0.05). d, The same analysis as Figure 3c in the main text, except that here we varied the latency applied between click time and neural representation (see Methods). While we would expect that an improper choice of latency would degrade the quality of the estimate of the accumulator value, the slope at the zero-crossing was still significantly larger for FOF compared to PPC for all comparisons (p<0.05).

