
Extended Data Figure 5. Individual neuron analyses.
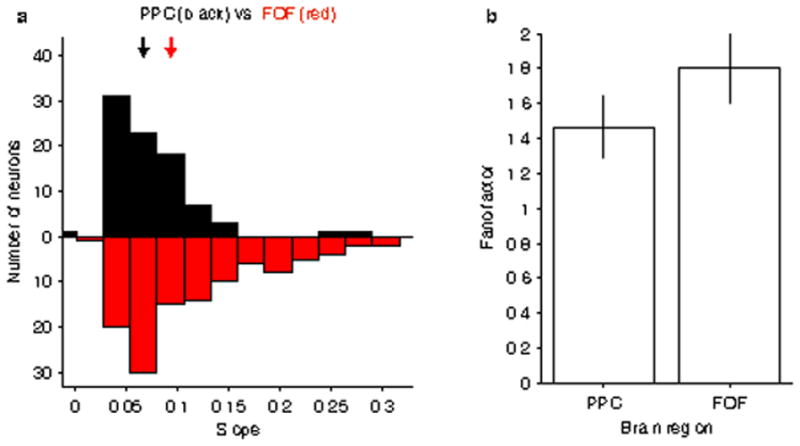
a, The mapping between firing rate and accumulator value is shifted towards steeper slopes for the distribution of FOF neurons compared to the distribution of PPC neurons. Bars show the histogram of individual neuron slopes obtained from a sigmoidal fit of the relationship between firing rate and accumulator value, averaging across time from 0.15 to 0.5 s. Black bars correspond to PPC and red bars correspond to FOF. The arrows indicate the medians of the two distributions. While there is considerable overlap between the two populations, there is a significant shift towards greater steepness for the distribution of FOF neurons compared to PPC neurons (p<0.001, rank sum test). A larger slope corresponds to a steeper change from low to high firing rates at the transition between negative and positive accumulator values. Thus, a steeper slope is associated with a more categorical as opposed to graded encoding of the accumulating evidence. b, To compare neural variability, we measured the fano factor for each neuron as a function of the accumulated evidence and compared across regions. There was not a significant difference in neural variability for the representations in the two areas (p = 0.23).