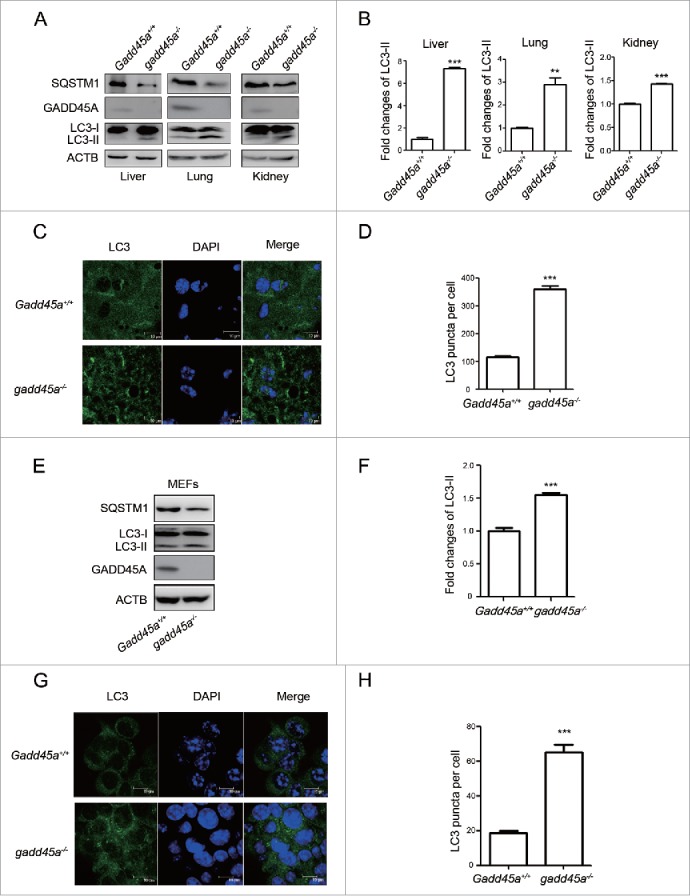
Figure 1.

Elevated expression of LC3-II in different tissues of gadd45a−/− mice. (A) Western blot analysis of LC3-II levels in liver, lung and kidney tissues of mice. All tested tissues homogenates were loaded and analyzed by 15% SDS-PAGE. (B, F) The densities of signals were determined by densitometry and are shown relative to the Gadd45a+/+ group. Graphical data denote mean ± SD. (C) Confocal microscopy images and immunofluorescence analysis with anti-LC3 antibody. Scale bar: 10 μm. (D, H) The number of LC3 puncta per cell. Graphical data denote mean ± SD. (E) SQSTM1, LC3 and GADD45A expression variation were analyzed using western blots in MEF Gadd45a+/+ and gadd45a−/− cells. (G) MEF Gadd45a+/+, gadd45a−/− cells were seeded onto the cover slips and analyzed by immunofluorescence with anti-LC3 antibody. Scale bar: 10 μm. ***,P < 0.001; **,P < 0.01.
