Figure 5.
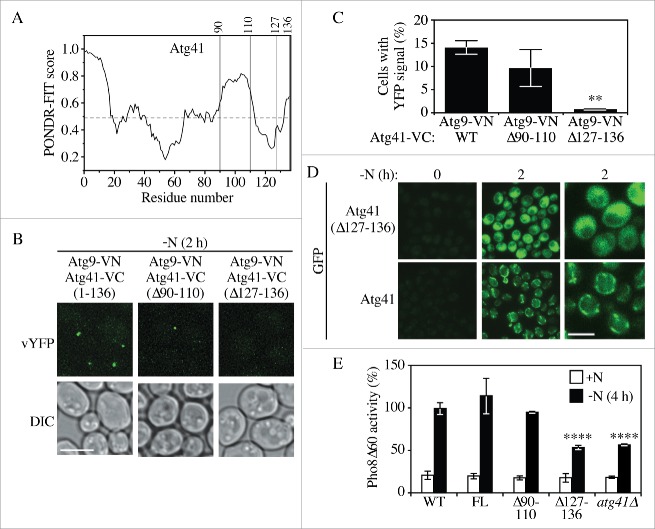
The C-terminal region of Atg41 is important for its function in autophagy. (A) Tendency of intrinsic disorder and probability of an Atg41 residue being in a disordered region, predicted by PONDR-FIT. Regions of the protein above the horizontal dashed line are predicted to be disordered. The vertical lines indicate the regions chosen for deletion analysis. (B) Representative images for a BiFC assay of Atg41-VC Atg9-VN cells expressing full-length (1–136) Atg41-VC (ZYY113), and deletion mutants Atg41(Δ91–110)-VC (ZYY119) or Atg41(Δ127–136)-VC (ZYY120). Cells were starved in SD-N medium before fluorescence microscopy analysis. Scale bar: 5 µm. (C) Quantitative analysis of the BiFC assay described in (B). The result is examined by 2-way analysis of variance (ANOVA). p values derived from the Sidak post test are reported for the comparison between wild type and mutant. **, p < 0 .01. (D) Representative images showing the distribution of Atg41-GFP (ZYY107) and Atg41(Δ127–136)-GFP (ZYY121) in cells before and after starvation in SD-N medium prior to fluorescence microscopy analysis. The right column of panels corresponds to a higher magnification. Scale bar: 5 µm. (E) Pho8Δ60 assay of a wild-type (WT; WLY176) or atg41Δ (ZYY105) strain, and strains expressing full-length (FL) Atg41-VC (ZYY116) and the indicated Atg41-VC deletion mutants (ZYY117 and ZYY118). Pho8Δ60 activity was set to 100% in the WT after starvation and normalized in the other samples. Error bar represented the SD of 3 independent experiments. The result is examined by 2-way analysis of variance (ANOVA). p values derived from the Sidak post test are reported for the comparison between wild type and mutant. ****, p < 0 .0001.

