Figure 6.
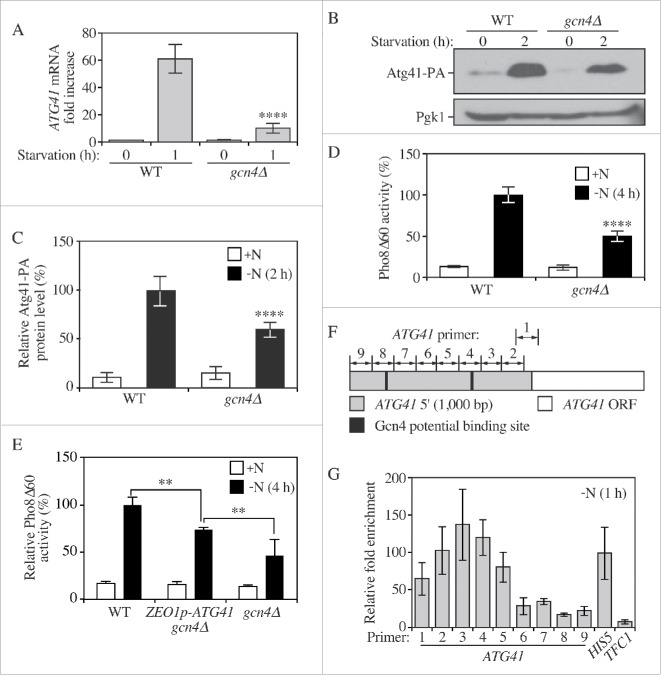
Gcn4 activates the transcription of ATG41 during nitrogen starvation. (A) The mRNA level of ATG41 in the wild-type (WT; WLY176) and gcn4Δ (ZYY122) strains was measured by RT-qPCR. Samples were collected in both growing (YPD) and starvation (SD-N) conditions. Error bars represent the SD of 3 independent experiments. The result was examined by 2-way analysis of variance (ANOVA). p values derived from the Sidak post test are reported for the comparison between wild type and mutant. ****, p < 0 .0001. (B) The Atg41-PA level of WT (ZYY108) and gcn4Δ (ZYY123) strains was analyzed by western blot. Pgk1 served as a loading control. (C) Quantitative analysis of the protein levels from the samples in (B). The protein level in the WT strain in starvation conditions was set to 100% and other samples were normalized. Error bars indicate the SD of 3 independent experiments. The result is examined by ANOVA. p values derived from the Sidak post test are reported for the comparison between wild type and mutant. ****, p < 0 .0001. (D) Pho8Δ60 assay for the WT and gcn4Δ strains. Cells were starved in SD-N. Error bars indicate the SD of 3 independent experiments. (E) Pho8Δ60 assay for the WT, ZEO1p-ATG41 gcn4Δ (ZYY127) and gcn4Δ strains. Cells were starved in SD-N. Error bars indicate the SD of 3 independent experiments. The result is examined by ANOVA. p values derived from the Sidak post test are reported for the comparison between ZYY127 and 2 other strains. **, p < 0 . 01. (F) Schematic picture showing the regions of the ATG41 5′ UTR covered by the indicated primers for analysis by ChIP; “1” corresponds to the ATG41–1 primer pair, etc. Gcn4 potential binding sites are shown as black lines. (G) RT-qPCR analysis of ChIP samples of the GCN4-PA strain (ZYY124). Numbers correspond to the primers illustrated in (F). The values were normalized to the positive control HIS5 (set to 100%). The error bars indicate the SD of 3 independent experiments.

